Stability Testing
All biological products must be manufactured to exacting quality standards, and the pharmaceutical and diagnostics industries in particular are highy regulated worldwide. Stabiitv of a pharmaceutical or diagnostic product is a key element of quality, and regulatory authorities ensure that useful-life claims are realistic
and demonstrable. Actual elapsed time (or real time) stability studies are, without doubt, the most reliable demonstration or exploration of a product’s useful or shelf life. The length of time required for such studies often renders them impractical. In the case of a new product, or in the case of a necessary or desirable change in manufacturing procedure, a technological or market lead could be lost or diminished due to delays related to potential stability measurement. Therefore, a reliable alternative to real time stability testing, such as one that can predict rates of decay at temperatures of interest, is clearly required. The method of accelerated storage testing, based on the Arrhenius equation, has the ability to do this. The method is not new; it was described over 30 years ago as a practical means of quality assurance for biological standards. Recent studies have greatly refined the accuracy and precision of the predictions derived.
Theory
It is apparent from studies of chemical kinetics that different chemical reactions belong to different orders of reaction. A zero-order reaction is one in which the reaction rate does not depend on the concentrations or activities of the reactants. Reaction rate is dependent on one reactant only in the case of a first-order reaction. A second-order reaction rate depends on the concentrations of two reactants, while a pseudo first-order process is one in which the crucial reaction involves two reactants, but only one of these is seen to change during the period of observation. Each of these types of reaction may be described mathematically in differential form as follows:
|
where —dCa/dt is the rate of change of the concentration of reagent a with time, k is a rate constant, Ca is the concentration of reagent a, and Cb is the concentration of reagent b.
The loss of biological function is the result of a chemical or biochemical reaction, which should be capable of description by one of the above equations. Very often, the loss of catalytic or other functional activity follows a true first-order process. This means that it is a single molecular event or “hit” that results in loss of activity, or that there is a constant probability per unit time that any intact molecule will become inactivated.
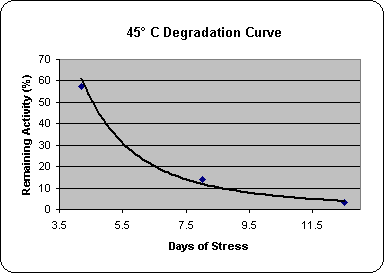
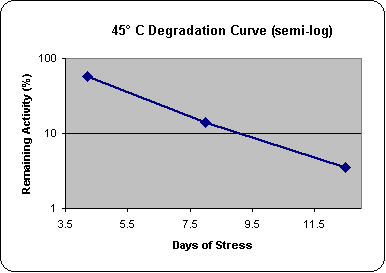
It is easy to ascertain whether the activity loss with time (at particular temperatures of interest) is first order. Many statistical packages are available for use on personal computers. Experimental data can easily be fitted to a first-order exponential equation.  Visual observation of the graphic fit and inspection of parameters such as standard errors and chi-square will show if the data are first order. First-order exponentials, in which the rate constant has units of reciprocal time, have the additional useful property that a semilogarithmic transformation of the data yields a linear plot, i.e., if log or In (activity) is plotted against time, a straight line results (Figures 1a and 1b). This property is not shared by second- or higher-order exponentials.
If the activity loss with time proves to be a first-order reaction, the experimental data obtained at different temperatures may be analyzed by the Arrhenius equation. This equation relates the activation energy for a particular reaction (i.e., the energy difference between the reactants and the transition state-activated complex) to the temperature and to the first-order rate constant, k. The Arrhenius equation may be expressed as follows:
k = A.exp (— Ea/RT)
or, in logarithmic form, as:
ln k=—Ea/RT+In A
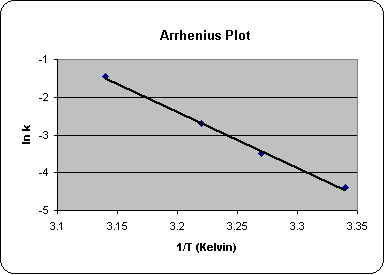
where k is the rate constant, A is the initial activity, Ea is the activation energy, R is the gas constant, and T iis absolute temperature.  It can be seen from the equation’s log form that a reaction obeying the Arrhenius equation will yield a linear plot of In k against 1/T and that the slope of this line will be —Ea/R. This provides a basis for determining the rate constant (and hence the useful life) at temperatures of interest.
The first-order rate constant will vary with temperature of reaction. The natural logarithm of the first-order rate constant determined at different temperatures is plotted against the reciprocal of the absolute temperature (i.e., expressed in kelvins rather than degrees Celsius). The resulting linear plot (Figure 2) can be extrapolated in order to determine the value of the rate constant at temperatures of interest, e.g., 4°C. From this derived rate constant, the useful shelf life can be determined by a simple calculation, once a suitable lower limit of acceptability has been defined (e.g., 90% of starting activity).
It should be pointed out that the parameters Ea and A in the Arrhenius equation can be expressed in terms of the quasi-thermodynamic quantities of the Eyring transition state theory:
ln k=In(k’/h)=S/R— H/RT+In T
where k is the rate constant; k’is Boltzmann’s constant; h Is PIanck’s constart; S and H are the changes(delta) in entropy and heat of activation, respectively; R is the gas constant; and T is the absolute temperature. Using the Eyring equation, values for the free energy and other thermodynamic parameters can be estimated for the activation process, but this is beyond the scope of this article. Suffice to say that both equations may be expressed in the following general terms:
In k = A + B/T + s.ln T
where A and B are unknown constants to be estimated from the experimental data, and s assumes the value of either 0 or 1. If s = 0, the Arrhenius equation is obtained;  if s = 1, the Eyring equation results. The Eyring equation involves fewer assumptions than does the Arrhenius, but either form may be used for accelerated testing and shelf-life prediction. Very good agreement was obtained between the Eyring and Arrhenius solutions during an accelerated storage study on blood coagulation Factor IX. It must be noted, however, that experimental data are subjected to a considerable number of transformations, notably logarithmic and reciprocal derivatives. Such transformations can greatly alter error relationships. Manual fitting of data must be strongly discouraged in favor of statistical fitting by computer-based systems.
The essential requirements for using the Arrhenius equation in accelerated storage testing may be summarized as follows:
1) The observed reaction is monomolecular.
2) The relationship between relative potency (% initial activity) and temperature is first order at all of the temperatures studied; otherwise extrapolations are invalid.
3) Only one chemical reaction occurs so that In k is proportional to 1/T. Sometimes the reaction at higher temperatures differs from that at lower temperatures.
Practical considerations in performing a test
An accelerated degradation test is conducted by placing samples at a series of elevated storage temperatures and comparing their activities with those of samples stored at a suitable low reference temperature. It is assumed that no, or very little, degradation takes place over the period of observation at this reference temperature. Note that experimental design, in terms of storage periods and sample numbers, is crucial to the successful outcome of the experiment. The principles that should be used to set up an accelerated degradation study will be explained.
Studies by Kirkwood and others have greatly aided in the rational design and implementation of accelerated storage tests. The factors affecting precision and accuracy have been reviewed, and any test must be designed to yield statistically acceptable precision without using too much biological material. It must also minimize experimental errors and include tests of the basic assumptions, namely that the degradation is first order and obeys the Arrhenius equation. It is recommended that at least three elevated temperatures plus a low reference temperature be used for each study and that at least 10 samples be set up at each of the temperatures employed.
A particularly convenient schedule of tests has been devised by Kirkwood and is carried out in three stages:
1. Material stored at the highest temperatures is tested at intervals against a low temperature reference sample. No other temperatures are tested until a loss of 25% or greater is recorded at the highest temperature. When this occurs, a second sample is tested to confirm the first result. If the results disagree, this stage 1 testing continues; if they agree, the investigation moves on to stage 2.
2. The next two highest temperatures are tested against the reference samples. All available data are fitted to the Arrhenius equation. A final precise result will not be achieved, but progress to stage 3 will be facilitated.
3. The approximate result from stage 2 is used to gauge further periods of storage for all temperatures so that measurable activity loss will have occurred at the intermediate temperatures. Samples from all available temperatures are assayed and all available data are checked to determine their ability to fit the Arrhenius equation. A reasonably precise estimate of the low temperature degradation rate should result, especially if multiple assays have been performed. Sometimes too little degradation may have occurred to yield a precise result. If so, stage 3 can be repeated after a longer time. This scheme avoids waste of material due to testing at inappropriate intervals and allows the order of reaction to be checked. An acceptable conclusion is very likely if enough material is tested at the beginning.
It should therefore be apparent from the theoretical and practical considerations discussed,that properly implemented accelerated storage testing can have great usefulness in estimating the shelf life of biological material stored at low temperatures. The authors have stabilized diagnostic enzymes by chemical modification9 and have successfully used accelerated storage testing to estimate shelf lives of native and modified enzymes. It is likely that real time testing and correlations will continue to be required by regulatory bodies. However, a combination of both procedures should provide the best approach to stability studies.
References:
1. Jerne, N.K. and Perry, W.L.M., Bull. Wld. Hlth. Org. 14, 167—1 82 (1956).
2. Kirkwood, TEL., Biometrics 33, 736-742 (1977).
3. Tydeman, M.S. and Kirkwood, TEL., J. BioI. Stand. 12,195—206 (1984).
4. Pope, Drugs & Cosmet. lnd. 127, 54-62, 116(Nov. issue, pages not Continuous) (1980).
5. Eisenburg, Crotmers, i., and Donald, M., Physical Chemistry (Benjamin/Cummings, Menlo Park, CA, 1979), pp. 239-245 (1976).
6. Brozovic, M., Kirkwood, TEL., and Robertson, I.,Thromb. & Haemost. (Stuttgart) 35, 222-236 (1976).
7. Kirkwood, TEL. and Tydeman, MS., J. Biol. Stand. 12, 207-214(1984).
8. Kirkwood, TEL., J. BioL Stand. 12, 215-224 (1984).
9. Ofagain, c. et al., Anal. Chem. 62, 1022-1026(1990).
10. Ofagain, C., Okennedy, A., and Kilty, C., Enz. Microb. Technol. 13,234-239(1991)


